Home » Planning Topics » Environment » Climate Action Planning » Measuring Progress » Buildings and Energy
2023 METRICS
METRIC 1
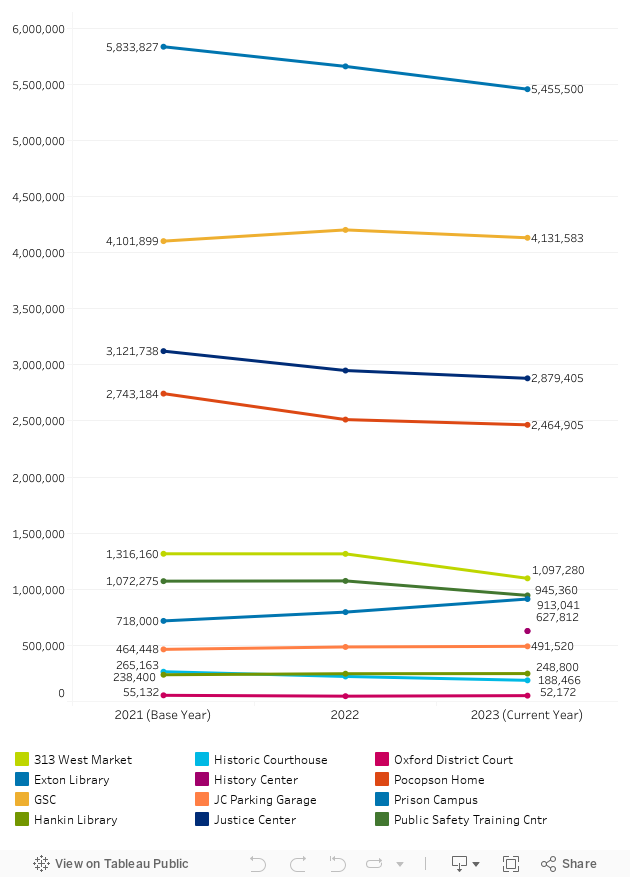
Electricity used in county buildings
Combined kwh of electricity used by all 11 county buildings currently tracked through Energy Star Portfolio Manager.
Electricity sourced from the grid (as opposed to on-site renewable energy) generates greenhouse gas emissions in its generation; therefore, using less electricity reduces the emissions associated with electricity generation. The county works to improve energy efficiency in all its buildings, however, this metric can also fluctuate based on the county's real estate purchases/dispositions (ie., acquiring a new building, or moving to a smaller or larger space).
Combined kwh of electricity
Data source: Energy Star Portfolio Manager.
2%
Decrease in electricity usage
SINCE BASE YEAR 2021
Steady decline
Change in electricity usage ranged from a 27% increase to a 29% decrease. In 2023 Chester County purchased the History Center, which is included in this metric result.
METRIC 2
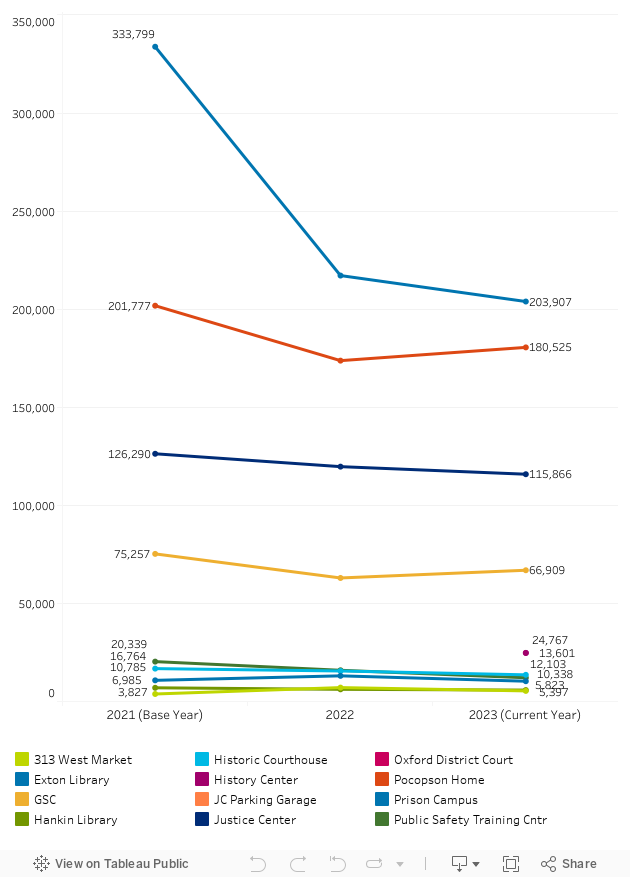
Natural gas used in county buildings
Combined kbtu of natural gas used by county buildings.
The majority of Chester County's government buildings are heated with natural gas, and reducing the amount of gas used will reduce greenhouse gas emissions associated with this heat source. This metric can fluctuate based on the weather (warmer winters where less heat is needed, etc.).
Combined kwh of electricity
Data source: Energy Star Portfolio Manager.
20%
Decrease in natural gas usage
SINCE BASE YEAR 2021
Declining gas usage
A steep drop in natural gas usage by the prison contributes most to the 20% decrease in natural gas usuage.
METRIC 3
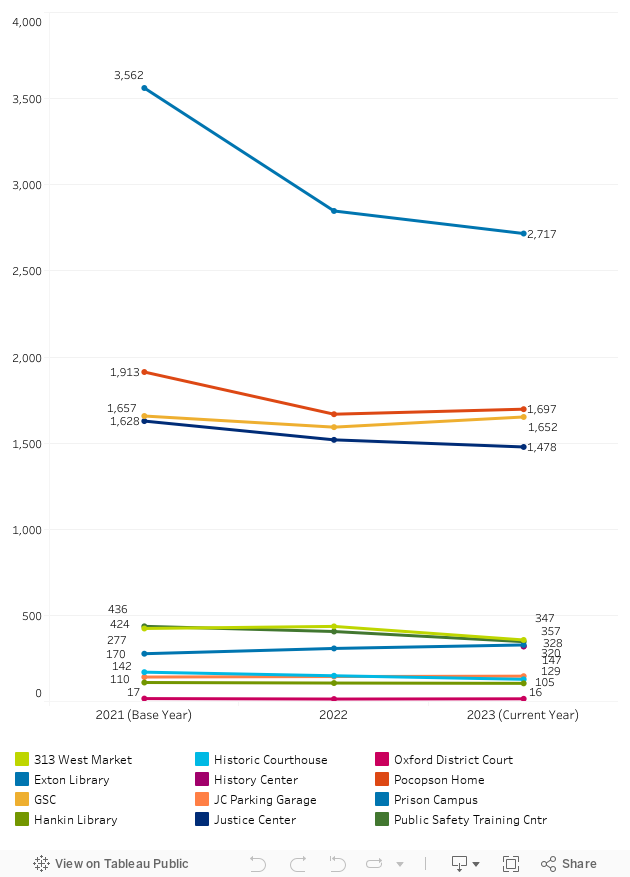
GHG emissions from county buildings
Total greenhouse gas emissions from 11 county buildings.
This metric tallies the estimated greenhouse gas emissions associated with the natural gas/fuel oil and electricity usage of each of the county's largest buildings.
Total GHG emissions (MTCO2e)
Data source: Energy Star Portfolio Manager.
13%
Decrease in greenhouse gas emissions
SINCE BASE YEAR 2021
Decreased GHGs
This 13% reduction includes the addition of a new facility in 2023 — the Chester County History Center.

METRIC 4
Electricity from renewable sources in county buildings
Percentage of total electricity used that is generated by renewable sources.
Chester County currently purchases Green-e RECs, or Renewable Energy Credits, to offset 100% of grid-purchased electricity for county facilities. To further reduce its carbon footprint Chester County joined the Southeastern PA Sustainable Energy Partnership in 2023 in order to procure electricity from renewable sources. In 2024 the Sustainable Energy Partnership adopted a goal of procuring 100% of its energy from renewable generation sources by 2035. SEP is currently purchasing electricity for 2025, and a portion of that electricity will be from renewable sources.
Total electricity used that is renewable
| |
2021
(base year) |
2022 |
2023 |
| Total kWh of electricity used |
19930226 |
19025512 |
19497867 |
| Total kWh of renewable energy generated onsite |
0* |
0* |
0* |
| Total kWh of renewable energy purchased |
0 |
0 |
0 |
| Renewable energy total |
0 |
0 |
0 |
| Percentage of total electricity used that is generated by renewable sources |
0* |
0* |
0* |
* Solar panels on the Oxford District Court are operational but output is unknown.
Data source: electricity bills from facilities office.
Renewable Energy Coming Soon!
Purchases of renewable energy through the Sustainable Energy Partnership will begin in 2025.
METRIC 5
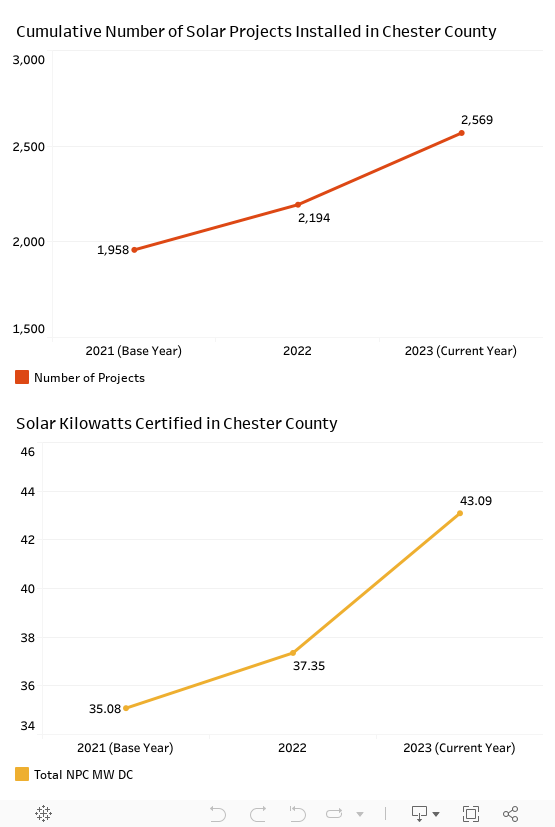
County-wide solar capacity
Total solar kilowatts installed county-wide certified through PA Alternative Energy Sortfolio Standards (AEPS).
Solar power is a renewable energy source with significantly lower life-cycle greenhouse gas emissions than electricity generated by traditional power plants. Installing solar panels is becoming more affordable and an attractive option as electricity prices increase.
Total solar kilowatts installed and certified through AEPS
Note: 2022 data was accessed on 1/22/23, so includes 23 days of January 2023 data
Data source: Pennsylvania Alternative Energy Credit Program; updated in real-time, tracked by Chester County Planning Commission annually.
31%
Increase in installed solar capacity
SINCE BASE YEAR 2021
An accelerating pace
The pace of solar installations accelerated between 2022-2023, potentially due to renewed incentives through the Federal Inflation Reduction Act.