
Housing Report — New Housing Units Sales
Home » Planning Topics » Housing » Housing Report 2024 » New Housing Units Sales
From 2023 to 2024 the number of new home sales decreased by 1%, and the median sale price decreased by 1%.
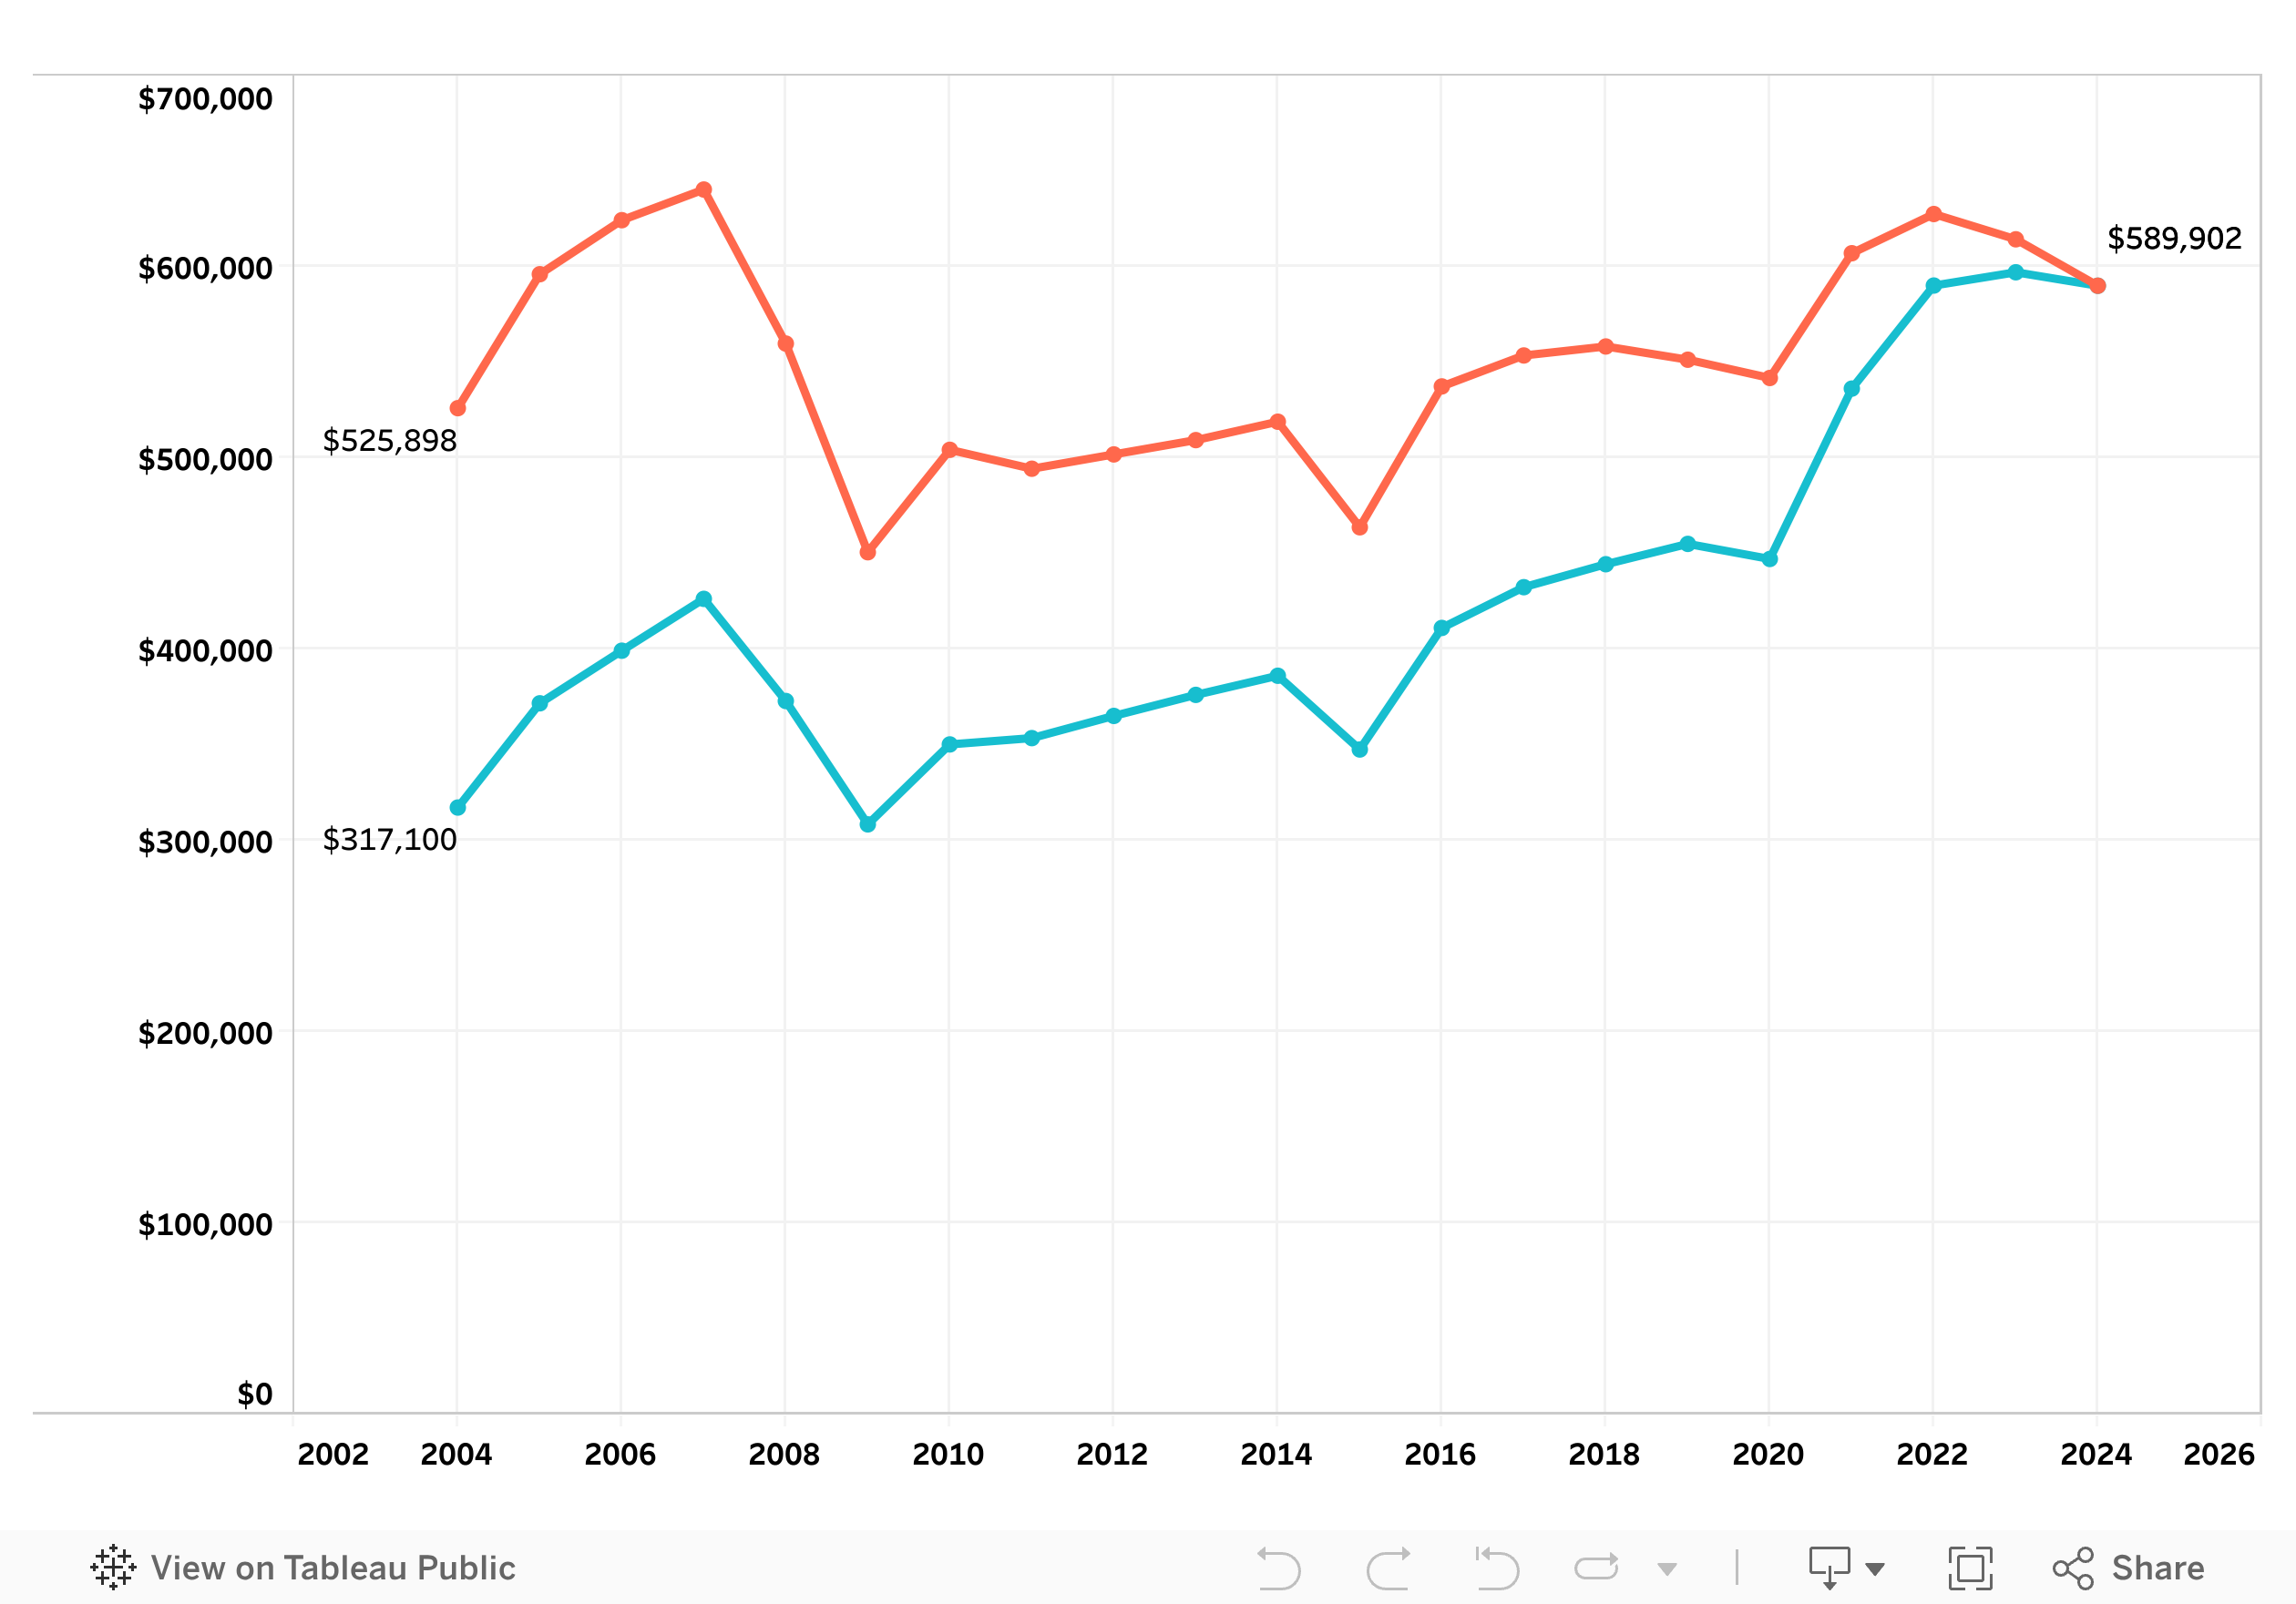
New housing unit sales are presented from 2004, the year the Planning Commission began calculating data for new housing. Adjusting for inflation, median new sale price decreased by 4% from 2023 to 2024.
| Year | Number of Sales |
Percent Change |
Median Sale Price |
Percent Change |
Median Sale Price Inflation Adjusted (2024) |
Percent Change |
|---|---|---|---|---|---|---|
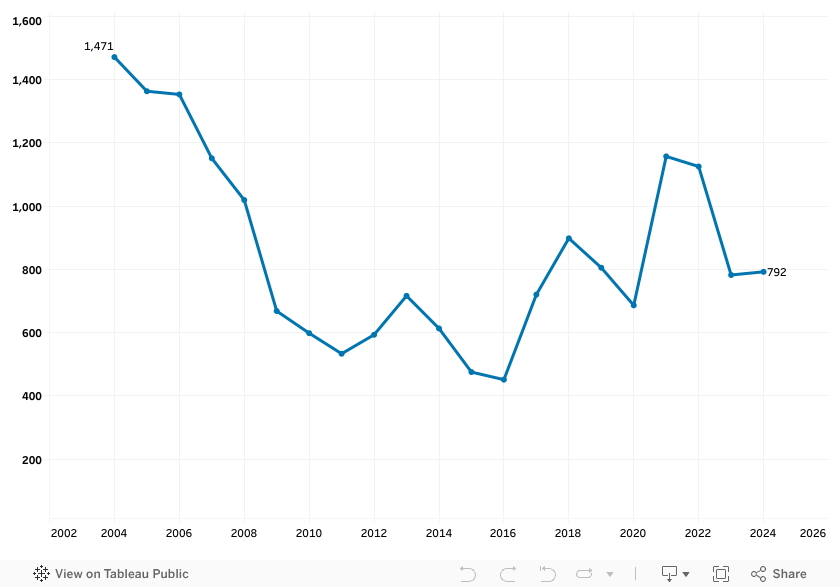
| 2004 | 1,471 | N/A | $317,100 | N/A | $525,898 | N/A |
| 2005 | 1,363 | -7% | $371,600 | 17% | $595,929 | 13% |
| 2006 | 1,353 | -1% | $399,100 | 7% | $624,172 | 5% |
| 2007 | 1,151 | -15% | $426,200 | 7% | $640,418 | 3% |
| 2008 | 1,019 | -11% | $372,800 | -13% | $559,666 | -13% |
| 2009 | 668 | -34% | $308,300 | -17% | $450,574 | -19% |
| 2010 | 598 | -10% | $350,100 | 14% | $504,124 | 12% |
| 2011 | 533 | -11% | $353,400 | 1% | $494,234 | -2% |
| 2012 | 593 | 11% | $365,000 | 3% | $501,722 | 2% |
| 2013 | 716 | 21% | $376,000 | 3% | $509,195 | 1% |
| 2014 | 613 | -14% | $386,000 | 3% | $518,813 | 2% |
| 2015 | 475 | -23% | $347,450 | -10% | $463,617 | -11% |
| 2016 | 451 | -5% | $411,000 | 18% | $537,268 | 16% |
| 2017 | 720 | 60% | $432,305 | 5% | $553,446 | 3% |
| 2018 | 898 | 25% | $444,305 | 3% | $558,147 | 1% |
| 2019 | 805 | -10% | $454,936 | 2% | $558,734 | 0% |
| 2020 | 686 | -15% | $447,056 | -2% | $541,678 | -3% |
| 2021 | 1157 | 69% | $536,124 | 20% | $606,895 | 12% |
| 2022 | 1125 | -3% | $590,000 | 10% | $627,388 | 3% |
| 2023 | 782 | -32% | $596,938 | 1% | $614,178 | -2% |
| 2024 | 792 | 1% | $589,902 | -1% | $589,902 | -4% |
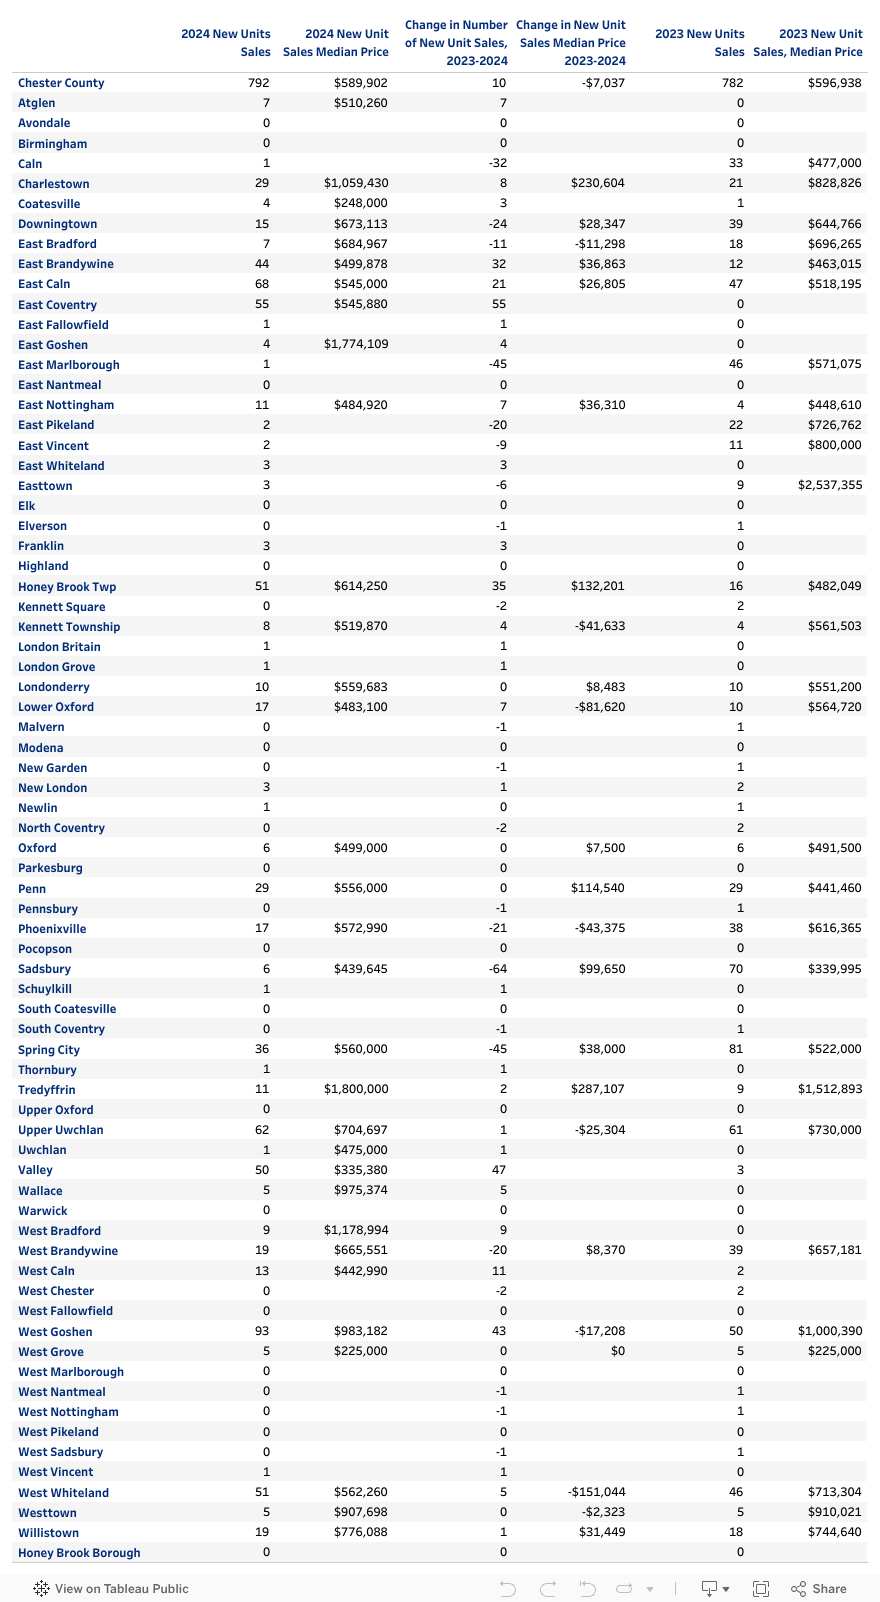
Of 73 municipalities in Chester County, 15% sold more than 20 new units, 12% added 10-20, 37% added 1-10, and 36% had no new units. West Goshen had the highest number of new units, with 93 new units sold in 2024.
For median sales prices of municipalities with over three new home sales, 3% were under $300,000, 1% were $300,000 to $399,999, and 44% were over $400,000. The remaining 42% had too few sales. Five municipalities had median sales prices of over one million dollars for new homes (Charlestown, East Goshen, Easttown, Tredyffrin, West Bradford).
New home sales in 2024 increased by 1%.
New unit home sale median prices have been trending upwards since 2008. In 2024 the median sales price for new homes increased even further to $589,901, down from 2023.
Of the 792 new unit home sales in 2024, 17% were sold between $250,000-$499,999. The number of new unit sales in the most affordable price range, of less than $250,000, increased insignificantly from 10 units in 2023 to 11 in 2024, remaining at 1% of total new sales.
| Price Range | 2023 Number All Sales |
2023 Percent All Sales |
2024 Number All Sales |
2024 Percent All Sales |
|---|---|---|---|---|
| Less than $250,000 | 10 | 1% | 11 | 1% |
| $250,000 - $499,999 | 217 | 28% | 131 | 17% |
| $500,000 - $749,999 | 349 | 45% | 435 | 55% |
| $750,000 - $899,999 | 118 | 15% | 80 | 10% |
| $900,000 - $1,499,999 | 68 | 9% | 104 | 13% |
| $1,500,000 and over | 20 | 3% | 31 | 4% |
| Total | 782 | 100% | 792 | 100% |
Median sales price for municipalities with three or fewer sales of new homes in 2024 were omitted. East Coventry, Valley, and West Goshen had the highest increases in the number of new housing sales. Sadsbury, East Marlborough, and Spring city had the largest decreases in number of new home sales.
Easttown, Tredyffrin, and Charlestown all had the highest increases in median sales price for new units. West Whiteland, Lower Oxford, and Phoenixville had the largest decrease in median home sale price for new homes.