


All Housing Unit Sales
Figure 2 — All Housing Unit Sales for Chester County (Number) 1990-2025
Since 1990, the sales of all housing units, both existing and newly built, has typically ranged from 5,000 to 8,000 sold each year. The late 1990s and early 2000s where a boom period. It ended with the Great Recession that began in 2008, when the annual number of sales dropped by over 20%. Since then, sales rose and remained at over 6,000 per year, even during the COVID Pandemic. Beginning in 2023, sales moderated to under 6,000 and in 2025 were 5,960.

Figure 3 — All Housing Unit Sales for Chester County (Number) 1990-2025
This chart illustrates the data presented in Figure 2. It highlights the major impact of the Great Recession, and the recent plateau of sales since 2023.
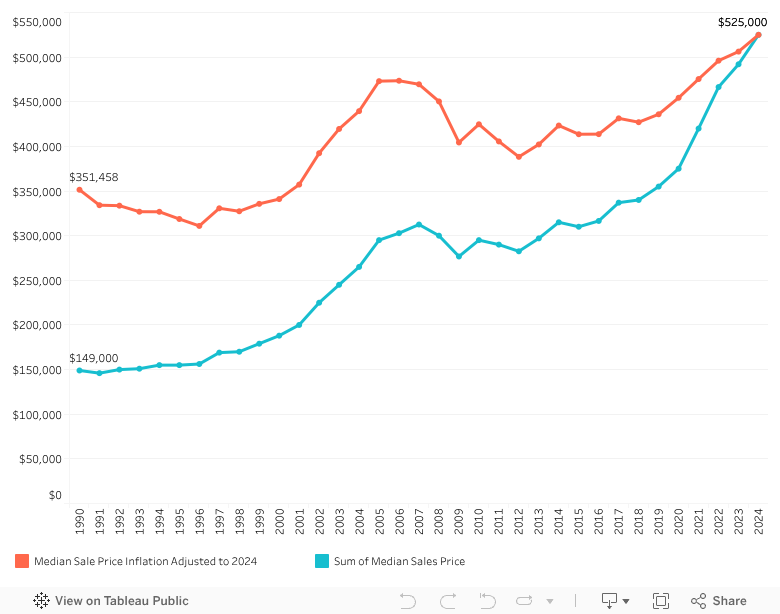
Figure 4 — All Housing Unit Sales by Municipality (Number) 2024 & 2025
Over the last two years (2024-2025), the townships with the highest sales numbers for all housing units, both existing and newly built, were: Tredyffrin (783), West Goshen (546), East Goshen (516), West Whiteland (495) and Phoenixville (469). These communities all have access to major highways like US 202/US 30 and US 422/PA 100. The lowest sales numbers were: West Marlborough (6), Modena (11), Highland (12), Newlin 14) and Avondale (15). These are either lower population boroughs with fewer undeveloped lots, or lower population agricultural communities with abundant land that is protected from intense development.

Figure 5 — All Housing Unit Sales by Municipality (Number) 2025
This map shows the number of sales by municipality for all housing units, both existing and newly built, in 2025. The least sales tend to occur in boroughs with smaller populations. The largest sales tend to occur in municipalities that are at the fringes of major transportation corridors.
Figure 6 — All Housing Unit Sales for Chester County (Median Price) 1990-2025
This table shows that median sales prices for all units, both existing and newly built, rose from 1991 ($146,000) to 2007 ($312,500). In 2008, with the onset of the Great Recession, prices dropped and then fluctuated until 2016, when they began to stabilize. They then rose steadily from 2017 ($340,000) to 2025 ($550,000). When adjusted for inflation, the changes were less dramatic, such that the sales for 2017 were $422,948, and for 2025 were $550,000.

Figure 7 — All Housing Unit Sales for Chester County (Median Price) 1990-2024
This chart illustrates the data presented in Figure 6. It highlights the major impact of the Great Recession, and the rise in sales since 2017.

Figure 8 — All Housing Units by Municipality (Median Price) 2024 & 2025
Over the last two years (2024-2025), the townships with the highest median sales price of all housing units, both existing and newly built, were: Easttown ($952,500); Newlin ($940,000), Birmingham ($897,500), Thornbury ($850,000), West Marlborough ($841,000). These communities are all either in the east of the county, or in the central "King Ranch" area. The lowest sales numbers were: Parkesburg ($270,000), West Grove ($257,777), Modena ($245,000), Avondale ($230,000), Coatesville ($167,000). These are mostly lower population boroughs with limited public transportation access to Philadelphia or Wilmington.

Figure 9 — All Housing Unit Sales for Chester County (Median Price by Range) 2024 & 2025
In 2025, the range of median sales prices of all housing units, both existing and newly built, was roughly one third $250,000-$499,999, and one third $500,000 -$749,999. A total of 69.1% of all sales were between $250,000 and $750,000.

Figure 10 — All Housing Unit Sales for Chester County (Median Price by Range) 2025
This map shows the median sales price by municipality for all housing units, both existing and newly built, in 2025. The lowest prices are mostly in lower population boroughs with limited public transportation access to Philadelphia or Wilmington. The highest prices are either in the east of the county, or in the central "King Ranch" area.
Figure 11 — All Housing Unit Sales by Municipality (Highest and Lowest Median Prices) 2021-2025
This table shows how municipalities rank in in terms of all median sales prices, for all housing units, both existing and newly built, but only for municipalities with at least ten sales. Despite this restriction, some trends are clear. Easttown and Birmingham consistently have the highest prices, while Coatesville, West Grove, and Parkesburg consistently have the lowest.
